The End-of-Semester limits are observed largely because all final reviews for studios and elective courses happen within a two-week period, making the Lab a very busy space, too busy if left un-checked. To better understand the activity in the Lab during this time, we wanted to share a closer look at the data available:
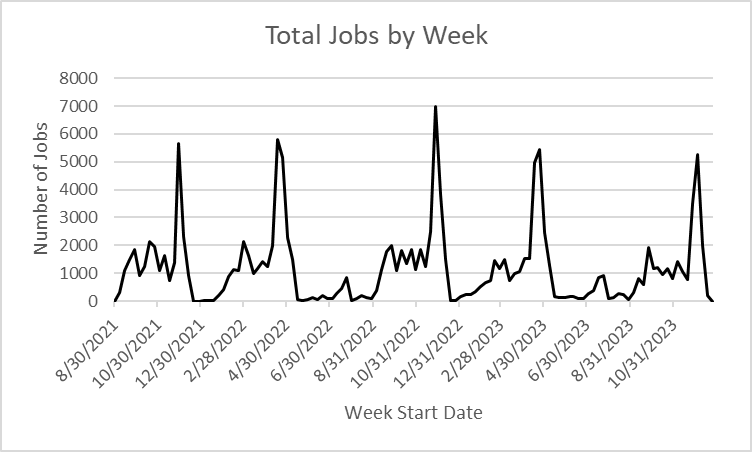
In the graph below, the total number of jobs (reported weekly) sent to Laser Cutters, 3D Printers, the CNC Router, and Zünd machines is represented across the past 5 semesters (including two summers). A fairly recognizable pattern emerges where the spike at the end of each semester is about 3 times the height of any previous spike.
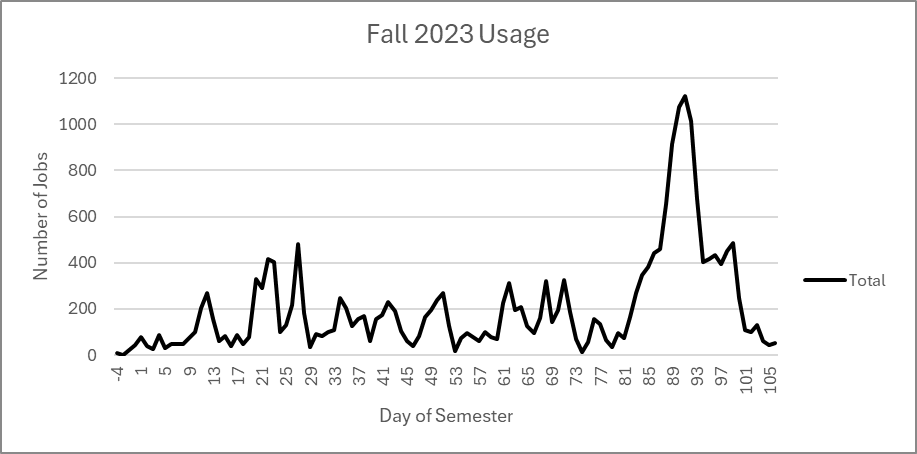
When the data from last semester is examined a little more closely, reporting jobs on a daily basis, the number of peaks and valleys increases, some days showing very little use and other days again representing use earlier in the semester as being one-third that of the busiest days at the end of the semester.
So, who is involved in this usage?
Again, probably not a surprise, but the data indicates that students enrolled in studio courses offered by the Department of Architecture generate the most use of the Fabrication Lab, followed by those in studio courses offered by the Landscape Architecture Department.
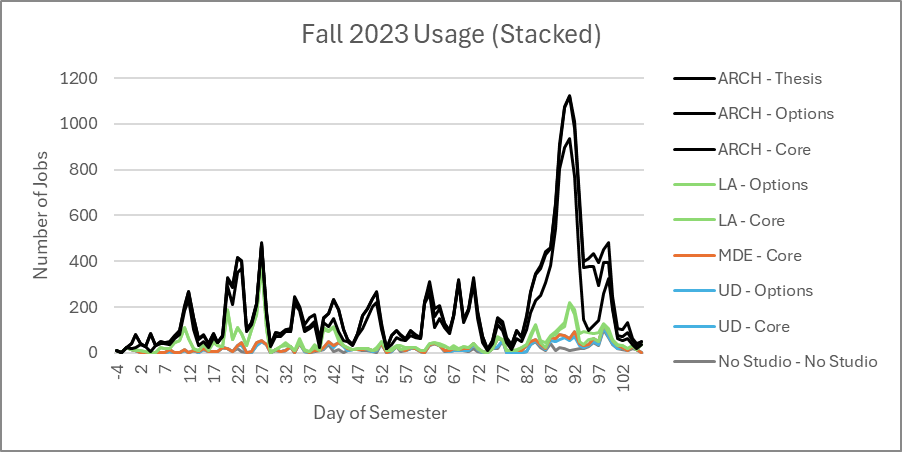
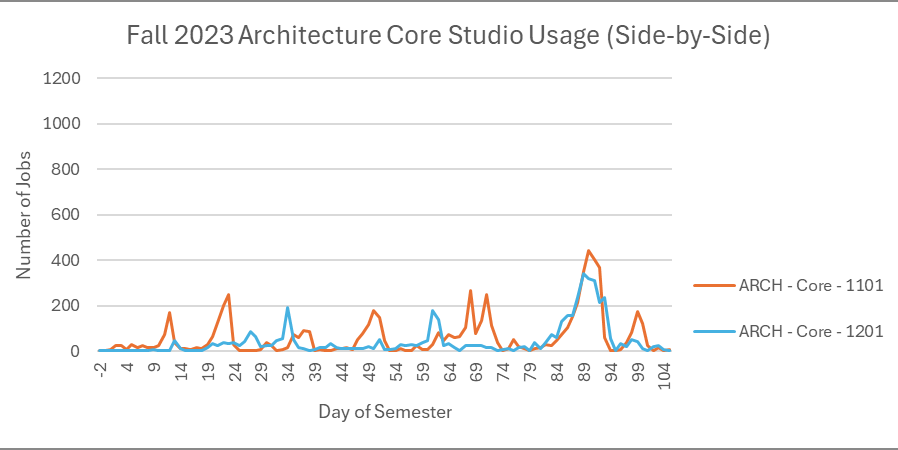
Within the studio courses offered by the Architecture Department, the jobs generated by the two Core studios comprise most of the prominent peaks, which occur in relatively equal measure throughout the semester (with the exception of the large peak sustained over a week towards the end of the semester).
For comparison, the studio courses offered by the Landscape Architecture Department contribute very few peaks to the pattern of overall use, and, interestingly, those peaks are more clearly weighted towards the start of the semester. (At least that’s the case last Fall.)
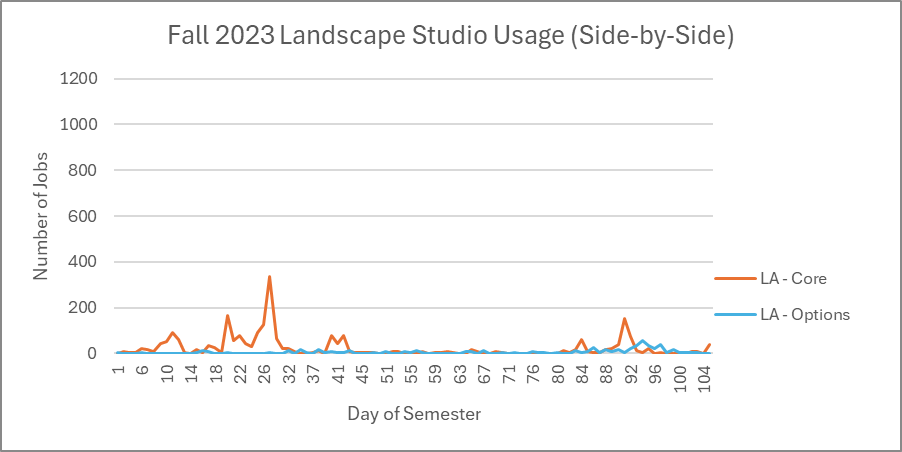
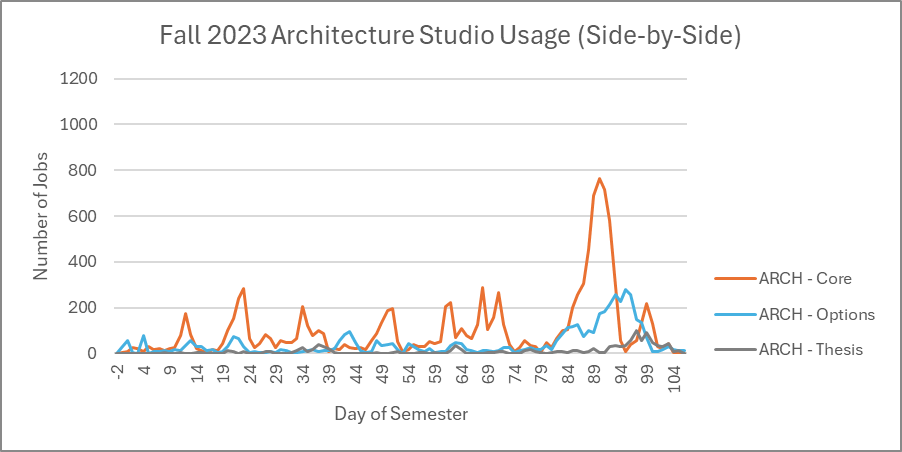
Getting back to the studio courses offered by the Architecture Department: in comparison to the Options studios, it makes sense that the peaks associated with the Core studios would be largest given that those studios have the greatest number of participants.
What does the data associated with the two Core studios indicate?
There’s relatively little overlap of the large peaks associated with each Core studio earlier in the semester. But that one large peak that happens at the end of each semester? It appears as though it is due to coincident use by participants of both Architecture Core Studios.
This makes one wonder:
What if final reviews for studio were scheduled differently?
Over the 5 days that reviews usually occur, what if Options studio reviews were scheduled throughout that period of time, rather than at the end? And what if Core studio reviews, rather than being scheduled for the beginning of that period, were instead separated by several days?
Large scheduling moves aside, what can individual Lab users do?
Looking at the data a little differently, it appears as though most studio participants are active within the four days before their final review (largely consisting of the Architecture Department Core studio participants, 80% of whom were active the third day before their final review). An exception to this is the MLA Core studio participants, many of whom appear to have been active the day before their final review (although not much more than 25% of the overall cohort).
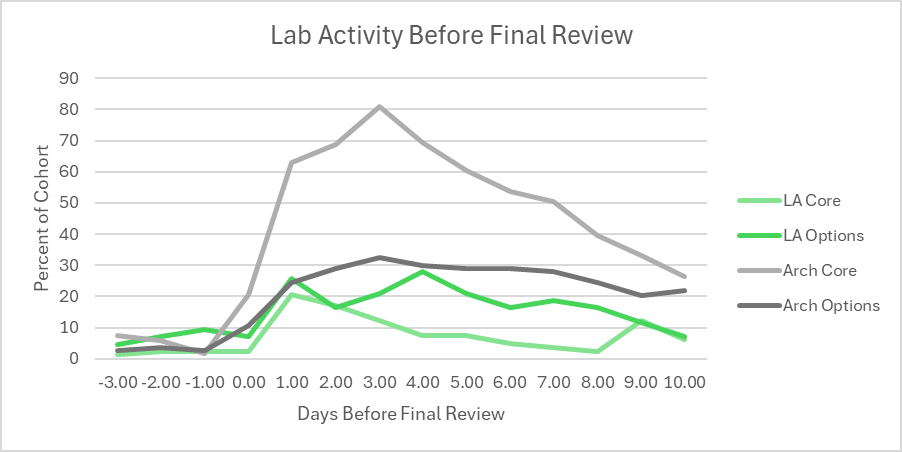
Within individual cohorts, most appear to have a relatively flat pattern of usage (no more than 30% of the cohort active in any given day) in the 10 days leading up to their final review, the exception being the Architecture Department Core studio participants. Perhaps the peak in activity associated with their use could be leveled-out by individuals being more active 7 or more days in advance of the final review.
How long does it take to make a final model, anyhow?
- What do you see in the data?
- How does this data reflect what you actually experience in the Lab?
- What ideas do you have to change it?
We’d like to Know!